It still blows people away when I set my GNUTERM var to 'sixelgd font "Arial,8" size 800, 600'
In xterm, you can use bash to type these two lines:
   $ export GNUTERM='sixelgd font "Arial, 8" size 800, 600'
   $ gnuplot -e 'plot sin(x)'
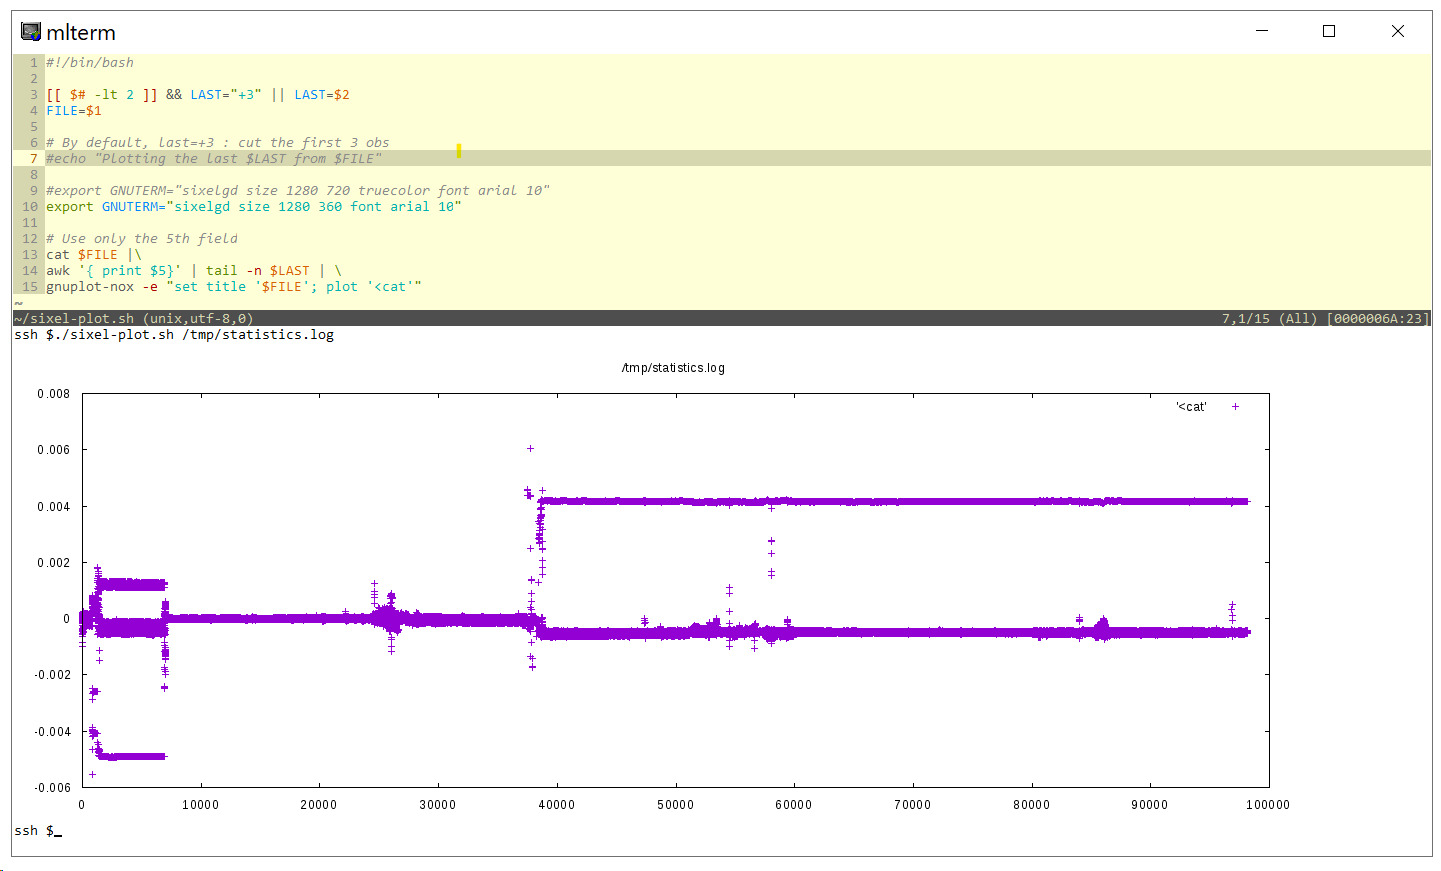
In the example screenshot I put on https://raw.githubusercontent.com/csdvrx/sixel-gnuplot/maste..., I was investigating time sync issues.
A plot immediately told me my first fix had corrected the issue on 2 servers, but I had mistakenly applied the same change to a 3rd one.
It still blows people away when I set my GNUTERM var to 'sixelgd font "Arial,8" size 800, 600'
In xterm, you can use bash to type these two lines:
And poof! a plot will appear.